Note: This post was adapted from a review I wrote on Quora.
This is a review of Statwing. Statwing is magic. You give it CSVs, and it imbues you with a godlike power to analyze data without really knowing statistics.
My main job involves hiring engineers for startups, but if you’re reading my blog, you probably know that a big part of what I do involves writing data-driven posts about trends in technical recruiting — Lessons from a year’s worth of hiring data and What I learned from reading 8,000 recruiting messages in particular. I’d like to pull back the curtain a bit to talk about a tool that has made creating content like this so much easier.
Way before I wrote my first post, I was a devoted admirer of OKTrends. That blog, to me, was the platonic ideal of good writing: actual data rather than conjecture, complex ideas made simple, unexpected insights into the human condition, interactive graphs, and dick jokes. It was perfect.
Then, a few years ago, when I finally had enough data to do something interesting, I ran across a rather upsetting Quora answer to How important was blogging to OkCupid’s success? Particularly distressing was this part:
The posts each took 4-8 weeks of full-time work for [Christian Rudder] to write. Plus another 2-4 weeks of dedicated programming time from someone else on the team. It’s easy to look at an OkTrends post, with all its simple graphs and casual writing style and think someone just threw it together, but it probably had 50 serious revisions.
The project I was working on (later to become Lessons from a year’s worth of hiring data) was an attempt to figure out what attributes of engineers’ resumes mattered the most when it came to getting offers. Here’s a screenshot of what the raw data looked like:
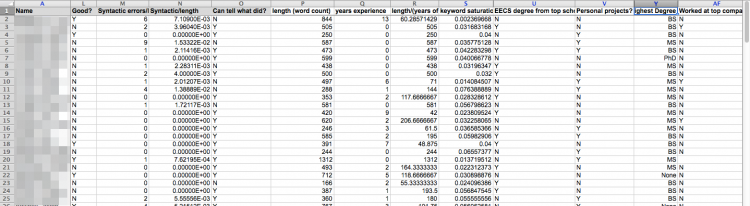
At the time, drawing conclusions from this mass seemed somewhat intractable, and after reading the answer about OKTrends I was really quite discouraged. After all, the last time I had done any kind of meaningful stats work was in high school. I started brushing up on statistical significance, what kinds of data merited what kinds of significance tests, what p-values meant, and so on. In parallel, I started looking for a viable Excel plugin that would run these tests for me in a way that didn’t force me to do a lot of preprocessing and would give me outputs that I didn’t have to do additional work to make sense of. I also started working through a few R tutorials, hoping that doing things at the command prompt would be less painful than clicking around Excel plugins aimlessly. Limping through R filled me with a vague existential dread, so I stopped.
Then, I saw a post on Hacker News about something called Statwing that claimed to simplify statistical analysis. I took it for a spin, uploaded a CSV file like the one above, and saw that I could click on any 2 column names and ask Statwing to tell me if the relationship between them was significant. Statwing ended up being game-changing and made it possible for me to churn out content I was really proud of a lot faster — it’s probably not an exaggeration to say that Statwing saved me a few weeks’ worth of work for each post.
To get an idea of what it actually does, let’s say you have the spreadsheet above and want to figure out if having syntactic errors (typos, grammar, etc.) matters when it comes to getting an offer. To do that, all you have to do is click the 2 columns, like so:
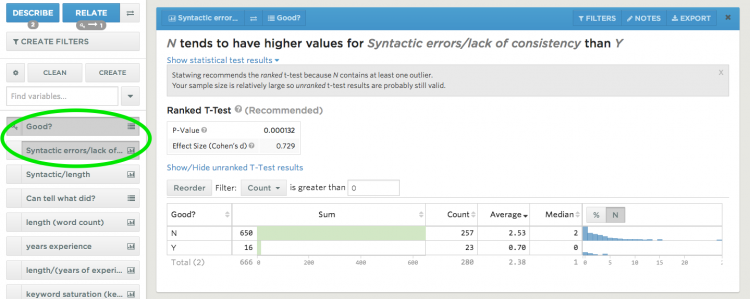
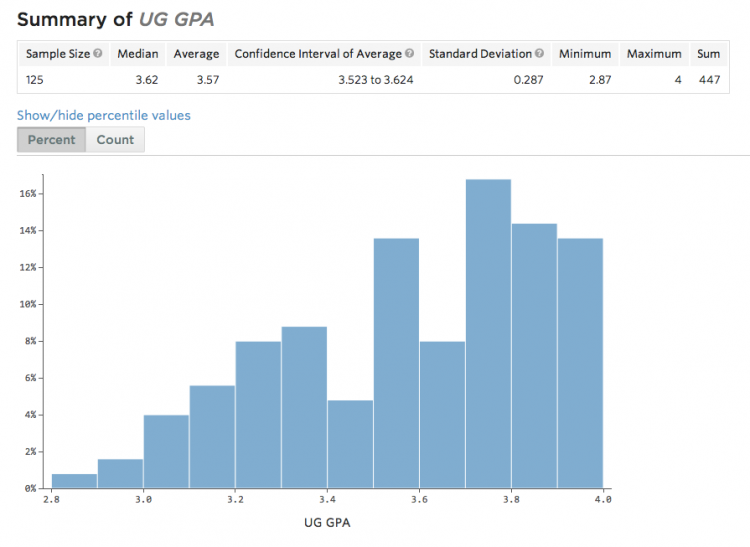
Statwing is also very, very good at classifying data into types (categorical, numerical, etc) and figuring out what tests are appropriate for that type, including noting when your data has outliers and modifying the statistical test accordingly (as you can see, above, Statwing chose a ranked t-test over an unranked one). It also provides the usual slew of descriptive statistics (means, std devs), lovely histograms, and so on. Below, you can see some descriptive stats and a histogram of everyone’s GPAs:
One of my favorite features is the filter that lets you analyze just a subset of your data. Here, you can see me trying to figure out if having an EECS degree from a top school matters specifically in candidates that come from top companies:
I now find myself relying on Statwing as a sort of exobrain wired for statistics — instead of having to agonize over which parts of the data I should analyze, I can do ALL THE ANALYSIS without tradeoffs, lowering the barrier to finding delightful and unexpected outcomes. In some sense, Statwing almost makes things too easy, and it’s important to remind yourself that statistical significance or a strong correlation do not necessarily make for insights and that there could always be selection biases, a third variable controlling everything behind the scenes, Simpson’s paradox, or some other beastie.
Statwing is still a young product, so there are certainly some things missing. Inside of Statwing, you’ll find all sorts of lovely interactive graphs. But, for now, you can’t embed them in places and have to make your own (protip: use Plotly). And, because a lot of the data I work with has boolean outcomes, I wish Statwing had support for logistic regressions (though I hear that this feature is currently in the works, so perhaps it’ll be a thing by the time you read this).
At the end of the day, while using Statwing won’t turn you into Christian Rudder, it can significantly reduce the amount of time it takes to run stats on your data and generally turn data analysis from something terrifying into a delightful, empowering experience. So, if you want to try your hand at doing some of your own OKTrends-style blogging, now you can, with less pain. Of course, figuring out what to write about, gathering the data, presenting it well, and, of course, making the requisite dick jokes is on you.